Research Topic & Significance
Recent elections at the national level of US government have resulted in poor outcomes for the Democratic Party, illustrated by their current absence in the White House and minority status in both houses of Congress. This erosion of power was precipitated by extremely narrow popular vote deficits in a handful of key "Battleground States". In an era defined by political polarization, Electoral College outcomes are no longer a matter of national appeal, but hinge on the voting patterns of geographic micro-factions. In a competitive and localized presidential election, small shifts in high-leverage counties can trigger disproportionate Electoral consequences for candidates.
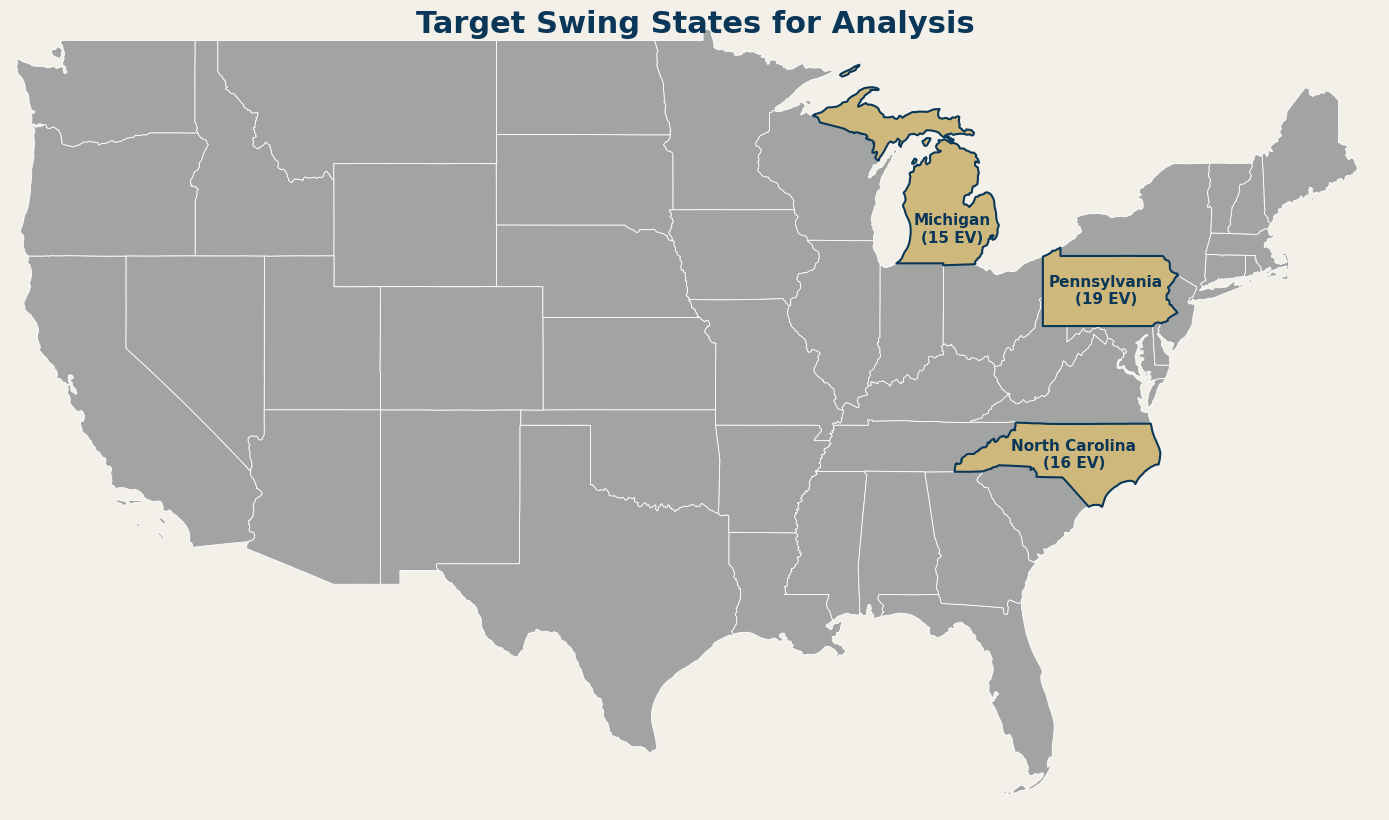
The 2028 Presidential election offers a critical opportunity for a Democratic reversal; however, success requires the precise identification of the electorate factions that decide outcomes within these key states. Our goal is to address this challenge by developing a model that identifies swing-state counties with the largest and most impactful variance in voting patterns. Through the integration of historical election results (2016–2024) and county-level census demographics—specifically in Pennsylvania, Michigan, and North Carolina—we aim to isolate counties that offer the optimal combination of electoral elasticity and vote volume. Our analysis will utilize k-means clustering and association rule mining to uncover the specific socio-economic feature sets that characterize these high-volatility electorates.
Stakeholders
The main stakeholders will be Democratic candidates, along with their campaign teams. They can use these models to help decide on which counties to focus on to maximize their voting returns. Additionally, clustering counties on similar demographics could help candidates devise a game plan for approaching certain counties, based on what has or hasn't worked for them in similar counties in the past. Our model can also be used for longer-term plans by Democratic political strategists beyond just looking at important swing states for the upcoming election; by running the model on more states, they can determine vulnerable counties they should invest time and money into to keep deep blue states blue or pick up ground in deep red states.
Another stakeholder is political media outlets. They could use our model to predict which counties will be the most important in the election. In turn, they can keep their audience more informed leading up to the election, and could improve their models for calling elections. The identified counties will be positively and negatively impacted, too. They'll get to host more campaign events and receive more campaign ads, which could boost the local economy and voter turnout. However, the increased attention and scrutiny could make it harder for local officials to run a smooth voting process.
Existing Solutions & Gaps
US presidential elections are a common area of study for political scientists and data analysts alike. Alan Abramowitz (1988) famously weighed presidential approval, economic growth, and duration of incumbent party leadership in his "Time For a Change" linear regression model predicting popular vote distribution. More recently, Helmut Norpoth's Primary Model rivaled Abramowitz's, introducing variables surrounding national primary performance. After correctly forecasting a Trump Victory in 2016, the Primary Model incorrectly predicted the following two presidential outcomes. Both of the models described above are reliant on nationally scoped data (economic conditions, incumbents, and primaries) rather than local dynamics. Further, both are more interested in predicting outcomes than identifying the factions that dictate electoral results.
Recent work has shifted to more granular analyses. Chen and Patel (2021) demonstrated the efficacy of a localized approach by narrowing the geographic focus to 15 states through a "Swing State Index". By applying hierarchical clustering to 2020 election returns, they identified distinct state archetypes—distinguishing demographic-driven shifts vs policy-driven shifts. Qualitative analysis was employed to attribute these patterns to specific political and cultural events. Crane, Koch, and Lin (2024) focused on counties rather than state trends, finding that US counties with relatively high stock market participation were more likely to vote for the incumbent party when accompanied by strong stock market performance.
While relevant research has localized, a significant gap remains. Chen and Patel have described past volatility at the state level, dismissing shifts in behavior at more granular levels. Crane et al. describe a univariate voting dynamic at the county level; however, they fail to consider the impact of variables beyond stock market participation.
Blueprint for Our Project
Our project begins with developing explicit research questions that ensure both feasibility and real-world utility. Data sources we are using include county-level census data, US Presidential Election county-level voting returns, and potential additions such as state polling in featured swing states and the American Community Survey. Alongside this, we will conduct prior research on the topic, identify existing gaps in the literature, and consider the needs of project stakeholders and future applications.
The analytical core of the project centers on several key methods. First, we will generate a custom "Volatility Score" to describe county variance in Democratic Party voting margin between the 2016, 2020, and 2024 elections. We will then employ K-Means Clustering to segment swing state counties into archetypes based on wealth, education, housing, and demographic metrics—with the potential addition of capturing the delta of key metrics to consider changes over election intervals. Finally, we will employ Association Rule Mining to identify combinations of county traits that signal electorate volatility and Democratic opportunity.
Research Questions
Results Application
-
Which counties illustrate a combination of electoral elasticity and impact (vote volume), maximizing the marginal utility of Democratic resource allocation?
-
Which swing-state counties had the highest electorate volatility between the 2016, 2020, and 2024 elections in terms of percentage/volume of Democratic votes?
-
What specific demographic and economic features distinguish "High-Volatility" county clusters from "Stable" clusters?
Hypotheses / Predictions
-
Electoral volatility (defined as the standard deviation of vote margin 2016–2024) is inversely correlated with wealth. Counties in the bottom quartile of median household income will exhibit significantly higher variance in partisan swing than counties in the top quartile.
-
A composite ‘Racial Diversity Index’ will demonstrate higher feature importance than any single demographic (e.g., ‘% Black’ or ‘% Hispanic’), suggesting that racial heterogeneity is a stronger predictor of Democratic vote share than individual demographics.
-
High-volatility counties function as macro-trend amplifiers rather than independent outliers. These counties will shift in the same direction as the statewide or national trend but with significantly greater magnitude, making them the highest-leverage targets for 2028.
Further Contextual Analysis
-
To what extent do demographic predictors of electoral volatility generalize across state lines? Specifically, does a model trained on high-variance counties in Pennsylvania successfully identify high-variance counties in Michigan, or are volatility drivers geographically distinct?
-
Does electoral volatility exhibit temporal consistency? Does the geographic composition of the ‘Swing Map’ exhibit significant shifts between the 2016, 2020, and 2024 cycles?
-
What is the statistical correlation between voter turnout variance and vote share volatility?
References
[1] Abramowitz, A. I. (1988). An improved model for predicting presidential election outcomes. PS: Political Science and Politics, 21(4), 843–847.
[2] Chen, Mason, and Saloni Patel. “A Statistical Study of Swing State Behavior in the 2020 US Presidential Election.” SDSS 2021, pp. 2049–2057.
[3] Crane, Alan D., Andrew Koch, and Leming Lin. 2024. “Real Effects of Markets on Politics: Evidence from US Presidential Elections.” American Economic Review: Insights 6 (1): 73–88.